Sea Winds
Can offshore winds save New England?
By Meredith Angwin
Marie Antoinette by By Jean-Baptiste André Gautier-Dagoty (Wikipedia)
Wind and Solar: The Impossible Takes a Little Longer
“The difficult we do right away: the impossible takes a little longer.”
When Queen Marie Antoinette asked the finance minister of France for more money, he supposedly said: “If it is possible, consider it done already. If it is impossible, it will take a little longer.”
A finance minister reassuring Marie Antoinette? That didn’t work out for either of them.
Offshore Wind
I was on a Zoom panel recently. It was sponsored by a chapter of the Sierra Club, and we discussed the role of nuclear energy on the East Coast. None of the panelists said, “we must shut down nuclear right now!” Some of us were real cheerleaders for nuclear, while others were only sort-of pronuclear. One (sort-of pronuclear) panelist said that we should keep existing nuclear plants going until offshore wind was built. This panelist expected that within fifteen years we would have an offshore wind backbone for the grid. We will also have better batteries and other innovations. At that point, the nuclear plants would no longer be needed.
Many people on the East Coast have put their faith in offshore wind. I think the reason is that we don’t have much offshore wind. Therefore, its possibilities are not constrained by too many facts about actual operation.
To consider the role of offshore wind in the future, I will work with the data I have. I will also reason by analogy. As the basis for this post, I will refer to two main documents and some back-up documents. The backup documents are only listed in the footnotes.
The impossible takes a little longer.
Can we count on offshore wind? Northeast
Let’s start by looking at an ISO-NE document about onshore and offshore wind in the Northeast, Wind and Power Time Series Modeling of ISO-NE Wind Plants.[1] This slide deck was published by ISO-NE. Most of the data in the deck was prepared by DNV, the company that performs operational wind forecasting for ISO-NE.[2]
Reading the time series wind charts
The charts in this time series are a little difficult to read. Here’s some guidance. I show two charts from the ISO-NE Slide deck:
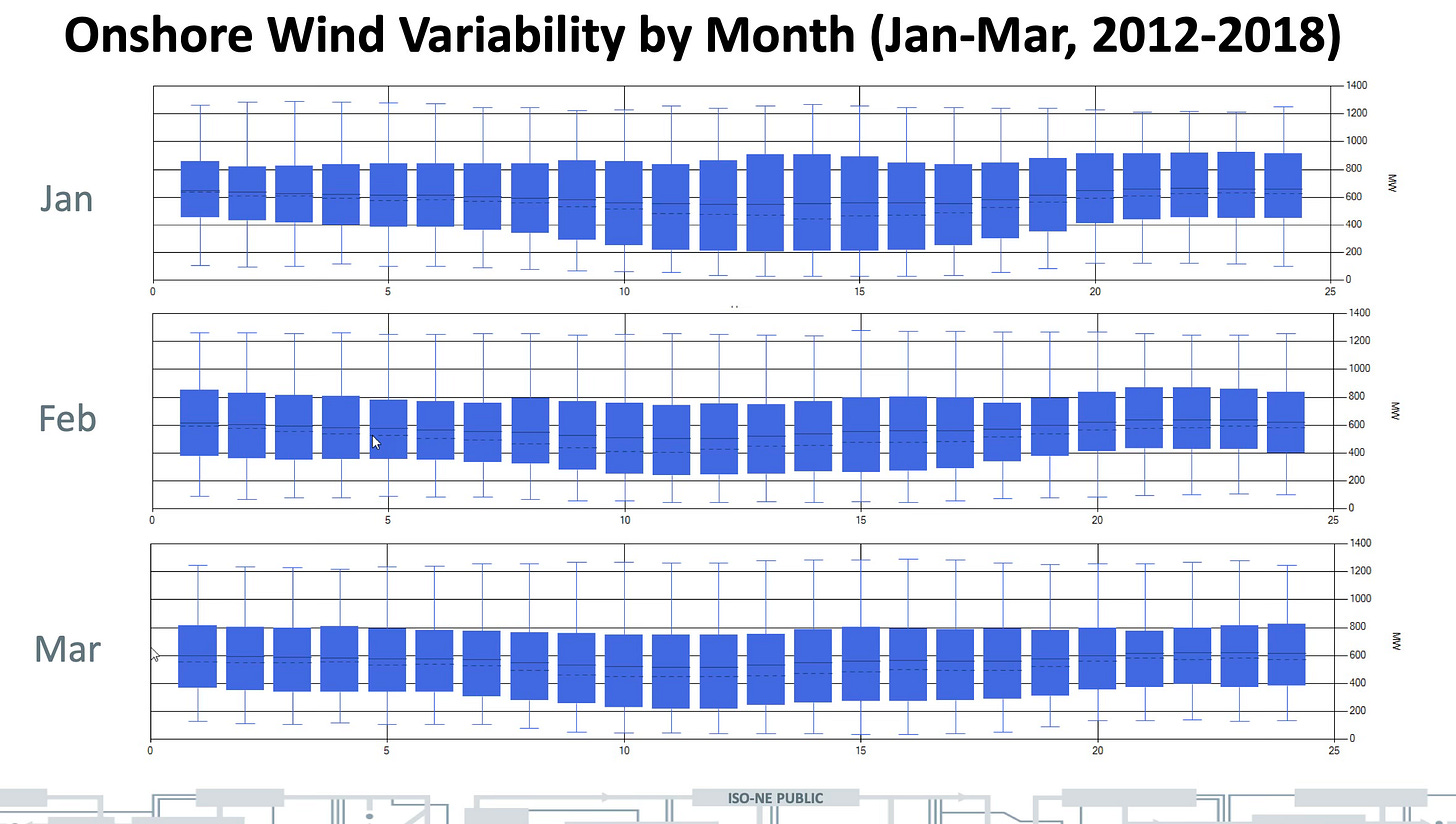
· Onshore wind variability by month, January to March (reference 1, page 10)
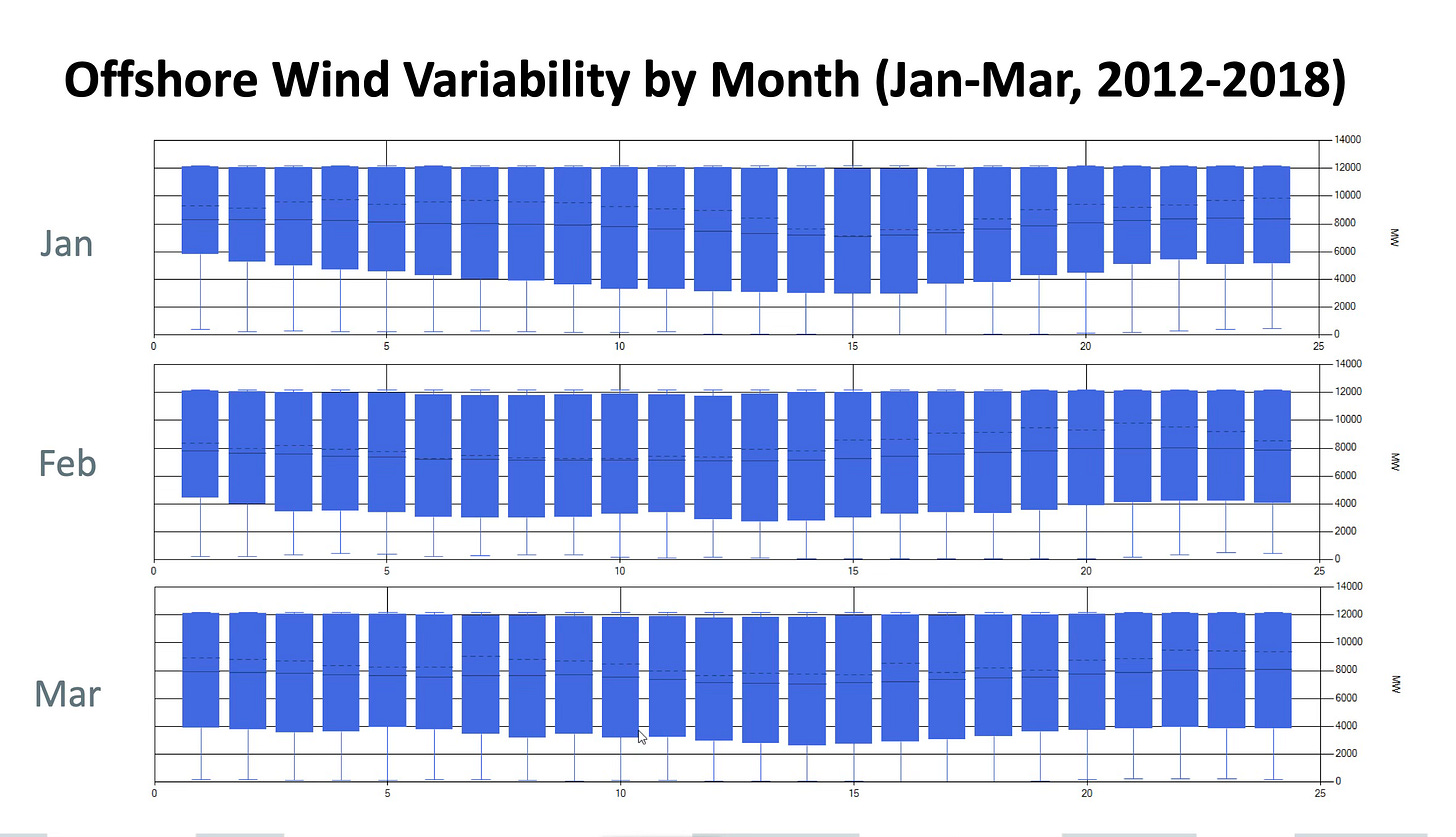
· Offshore wind variability by month, January to March (reference 1, page 11)
Onshore: For each hour of each day in the month, the onshore wind output was measured, for each year from 2012 to 2018.
The wind measurements were aggregated into the chart that you see. Each box represents measurements for every day of that month, for each of the seven years 2012-2016. The numbers across the bottom (0 to 25) market the hours of the day. Therefore, if you want to see the onshore data for 10 a.m. in February, go to the onshore charts. Then go to the February chart and look above the number 10. This data is for 10 a.m. of every day in February between the years 2012 and 2018.
The 10 a.m. in February data stretches between about 1200 MW (top measurement, extreme high “whisker”) and about 10 MW (lowest measurement, extreme low “whisker”). The blue box is the middle two quartiles of data points and contains lines marking the average and the median of the data points. A “box and whiskers” chart is often used in statistics. This chart is the simplest statistical display which shows the distribution of the measurements.
Most of the data for 10 a.m. in February (middle two quartiles) is between about 300 MW and 800 MW.
Offshore: There are similar boxes on the offshore wind charts. But these charts are a little different. The offshore numbers are reported as MW, but they aren’t really MW. The offshore numbers range from nearly zero to 12,000 MW (extremes) and 4,000 to 12,000 MW (quartiles).
However, the actual installed wind offshore in New England is 30 MW. The top number (12,000 MW) is a theoretical build-out that may or may not happen in the future. The numbers that range from zero to 12,000 megawatts are based on wind speed measurements. They are shown as the MW that amount of wind should be able to produce, assuming as 12,000 MW installed capacity offshore.
ISO-NE does not recommend this number (or any number) for the build-out of offshore wind. However, ISO was researching a different scenario, and they needed to calculate the effect of 12,000 MW offshore wind. They decided to use the same scenario for this analysis.
It's worth noting that the offshore boxes are bigger numbers (more wind) than the onshore boxes. But is offshore wind steadier? Is offshore wind more variable, on a ratio basis? It’s not clear, without detailed analysis. For example, a typical onshore box (looking at 10 a.m. February again) is roughly between 300 and 800 MW. The offshore box is between 4,000 and 12,000. It would require a careful analysis of the actual data to see if onshore or offshore was more variable. However, it is clear to me that offshore is not as steady as the pro-wind rhetoric would have you believe.
If we did build 12,000 MW offshore, the 4,000 to 12,000 variability in output would be difficult for the grid to manage. If the wind died down suddenly, it would be as if eight 1000-MW traditional plants all went off-line at one time.
Is offshore wind there when you need it?
ISO-NE also did an analysis of how on-shore and off-shore winds performed on summer peak days. Once again, the charts are by hour of the day. In this case, however, the days chosen were the days in summer that had peak demand.
My conclusion was that offshore wind was not much more reliable than onshore wind during peak demand in summer. My summary:
· Onshore wind for top 1% of gross load days: Hourly output range between 63% and 5%. Average output 28% of nameplate with standard deviation of 12%. (reference 1, page 19)
· Offshore wind for top 1% of gross load days: Hourly output range between 98% and 2 %. Average output 51% of nameplate with standard deviation of 32%. (reference 1, page 20)
Or to quote directly from slide 20
“For …a… summer peak weather day, offshore wind could be as high as 100% (of installed capacity) or as low as 2% for any hour of the day.” (reference 1, page 20)
Even more data!
ISO-NE was kind enough to share several more ISO and DNV reports with me.
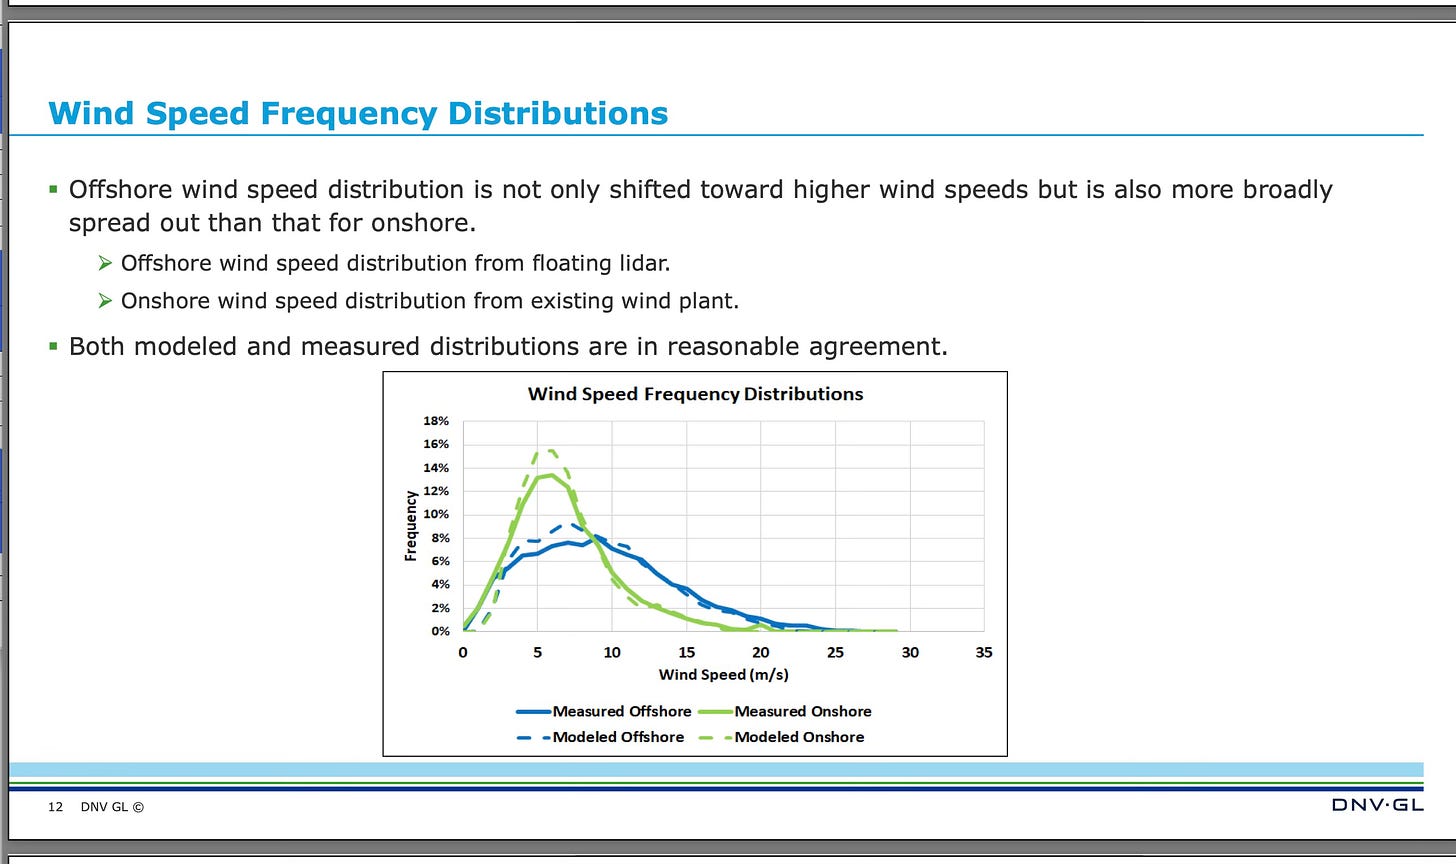
Onshore wind speeds form a rather traditional bell-shaped curve, while offshore wind speeds are skewed to the lower speeds. However, the offshore wind speeds are still higher than the on-shore wind speeds. (reference 4, slide 20). This slide is from an early (Feb 20, 2020) DNV report.
The greater spread of speeds for offshore wind probably has two causes:
With higher speeds, more variation is possible
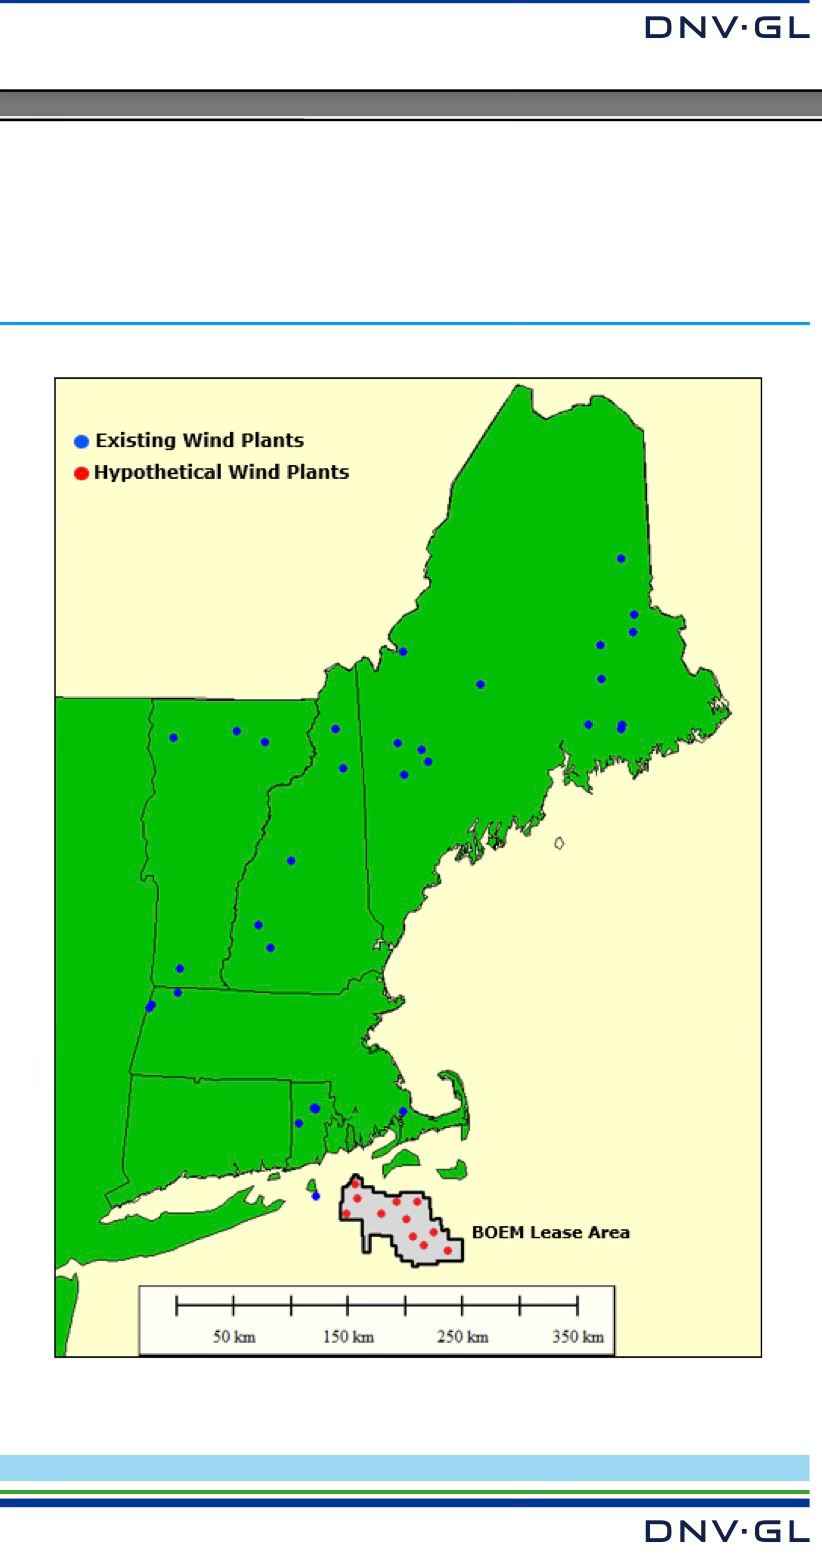
There are wind farms located all over New England while the lease area for offshore is comparatively small. The onshore wind farms show an averaging effect, due to their geographical spread.
Wind farms in a small area offshore means that that the offshore wind speeds will probably not show the averaging effect shown by widely dispersed wind farms on land. On the other hand, the existing lease area is small, but it is not the only lease area that would probably be used if 12,000 MW of wind were built.
Let me note that the slide above is substantially the same as the equivalent slide in the final report. “Analysis of Stochastic Dataset for ISO-NE, DNV-GL, 24 February 2021.” (Reference 5, figure 5-3 page 71.)
The figure below shows the geographical location of wind farms and proposed wind farms. The graphic is from Reference 4, slide 10.
My conclusion for the Northeast.
Offshore wind provides more MW than onshore wind. It does not provide more reliability, as far as I can tell from the various reports.
What if you had both wind and solar?
Texas has a great deal of both wind and solar. None of Texas wind is offshore. However, as I noted above, offshore wind does not seem to be more much reliable than onshore wind, though it is more abundant. So I decided to look at the combination of wind and solar, in Texas.
Michael Caravaggio published an excellent analysis of Texas data[6]. Caravaggio is Director, Thermal and Hydro Fleet at EPRI. (Back in the day, I was a project manager at EPRI’s Palo Alto offices.)
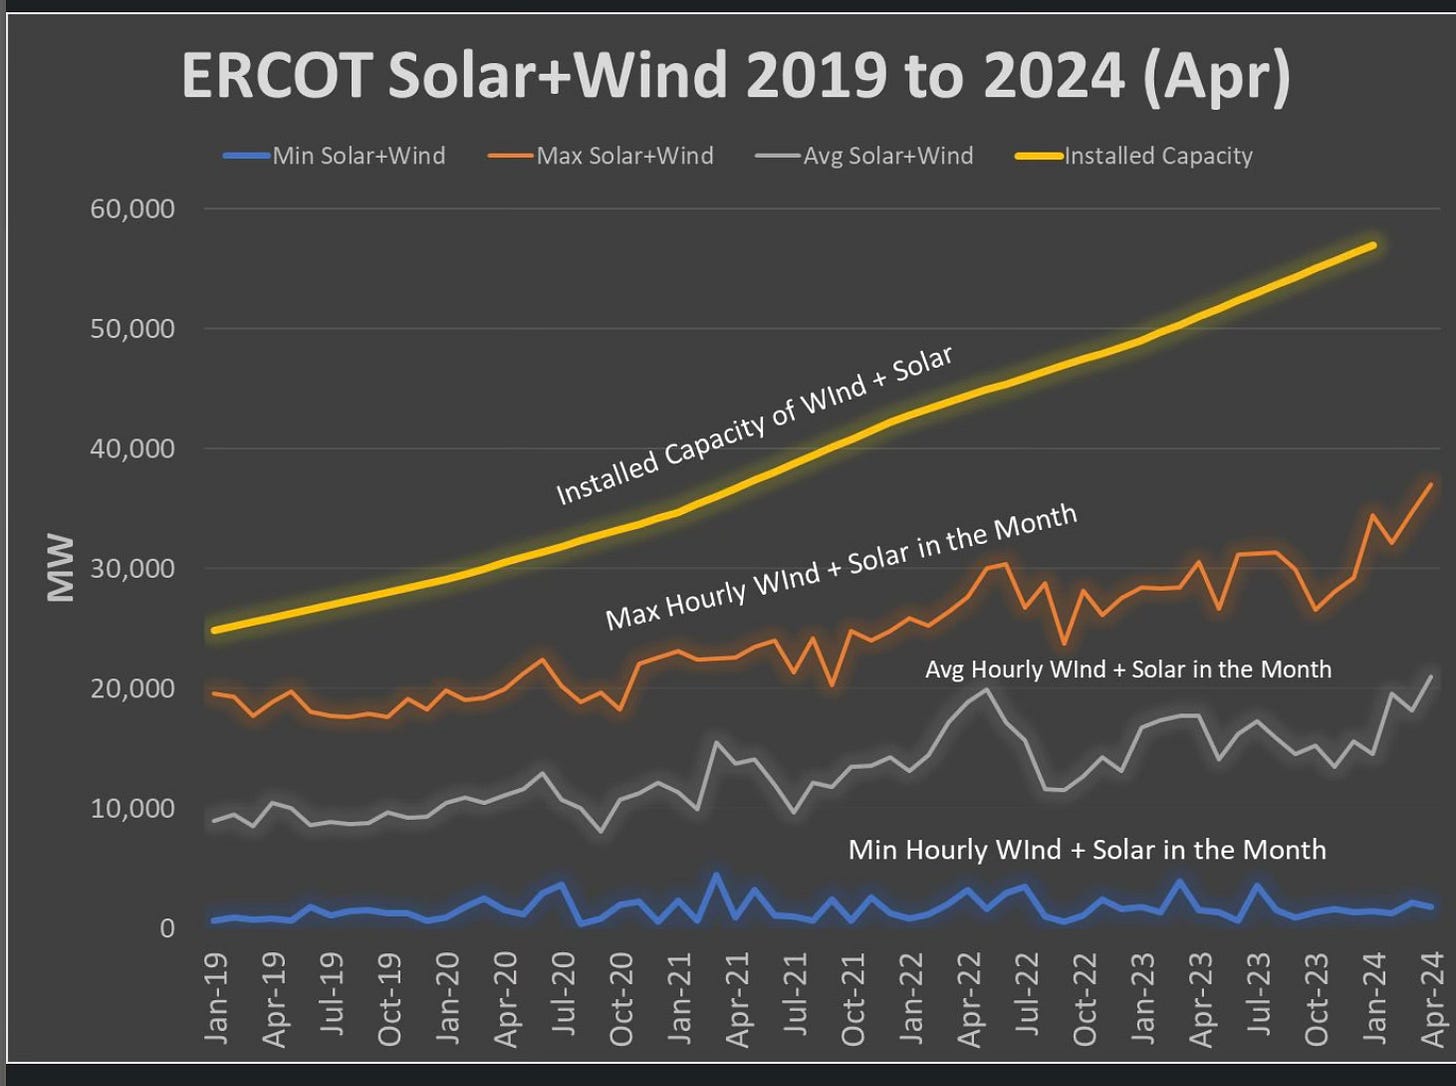
Caravaggio uses Texas data from EIA. Once again, we are looking at multi-year data, in this case between 2019 and 2024.
Caravaggio’s chart below shows minimum and maximum solar plus wind in Texas. A chart is worth a thousand words, but I will also share some of his words from the LinkedIn post.
“The maximum output in each month is typically ~60% of the installed capacity. The average (which is essentially the capacity factor) is ~33%. And the minimum hourly output in each month is typically 4% (in some months it is less than 2%)……
Those minimum hours are a challenge for reliability on an average month there will be an hour where for every 100MW of Wind+Solar there will be ~4MW output, and in some months this will be less than 2MW.”
The whole world over?
When I look at actual data, taken over several years, offshore wind is extremely variable, onshore wind is also variable, and onshore wind plus solar (in Texas, a big solar and wind state) can dip to merely 2 -4% of installed capacity at times each month.
In other words, there will be times when wind (offshore and onshore) can provide only 2 to 5% of its installed capacity (ISO-NE references above). Wind plus solar in Texas (a windy, somewhat arid state) can dip to similar levels. This may be a long way to say that sometimes the wind doesn’t blow and the sun doesn’t shine, but it is still important to keep this in mind. If solar and wind add up to less than 20% of net production, this situation can be handled. If we push solar and wind to 80% of net production, we will have to get used to rolling blackouts.
We need reliable plants for the grid. Plants that are not weather dependent. We need them even if we have offshore wind turbines (Northeast). Even if we have solar plus wind (Texas).
Sometimes, solar and wind are basically bankrupt.
Don’t be like Marie Antoinette’s finance minister
I don’t know whether the story of Marie Antoinette and the finance minister is true. But I do know that if the Queen was asking for money in 1787 or later, she was unlikely to be successful. France didn’t have any money. France had financed the Seven Years War and the part of the American War of Independence. The French government was in debt, and lenders were increasing the interest they required on any loan.
In this case, the minister’s response that “If it is impossible, it will take a little longer,” meant “this is not possible.” The finance minister was not being honest with the Queen. France was close to bankrupt.
In contrast, people who believe that that wind and solar will be able to replace nuclear in fifteen years are not being dishonest. They believe what they are saying. They think wind and solar with be enough, with a little help from batteries. Wind supporters are not deliberately lying.
However, wind plus solar plus some batteries cannot replace steady power. A grid cannot run on just solar, wind and batteries. It is impossible to run a steady grid with no fossil, no nuclear, no hydro.
Sometimes, “a little longer” means “never.”
Acknowledgements
Huge thank you to Eric Johnson and others at ISO-NE for helping me find the information I needed and linking me to the DNV-GL presentations.
Another huge thank you to Michael Caravaggio for permitting me to use his graphic.
An apology to my readers. I wound myself up in knots with the references, and the footnotes are not the way I would like them to be. I am still learning Substack! I think everyone can trace my sources, however, though the post doesn’t look as neat as I would like it to look.
[1] “Wind and Power Time Series Modeling of ISO-NE Wind Plants: Introduction and Preliminary Insights” Author is Steven Judd, PE, Lead Engineer, System Planning. Slide deck published by ISO-NE February 20, 2020 https://www.iso-ne.com/static-assets/documents/2020/02/a7a_wind_power_time_series_isone.pdf
[2] The company name has been changed from DNV-GL to DNV, in 2021. DNV’s scope is international, and its headquarters are in Oslo, Norway.)
[3] “Scope of Work for Stochastic Time Series Modeling for ISO-NE;” Author: Steven Judd, PE, Principal Engineer System Planning. ISO-NE slide deck, published July 22, 2020 https://www.iso-ne.com/static-assets/documents/2020/07/a4_scope_of_work_for_stochastic_time_series_modeling_for_iso.pdf
[4] “Wind and Power Time Series Modeling of ISO-NE Wind Plants: Methodology and Analysis of Results.” DNV-GL slide deck published by ISO-NE, February 20, 2020 https://www.iso-ne.com/static-assets/documents/2020/02/a7b_wind_power_time_series_dnvgl.pdf
[5]“Stochastic Time Series Modeling for ISO-NE: Results and Next Steps. Revision 2.” Author Steven Judd, PD, Principal Engineer, System Planning. ISO-NE slide deck published February 17, 2021
[5] “Analysis of Stochastic Dataset for ISO-NE.” DNV-GL slide deck published by ISO-NE, February 24, 2021
[6] Michael Caravaggio, Looked at Hourly Wind and Solar for ERCOT, published on LinkedIn, early May 2024 https://www.linkedin.com/feed/update/urn:li:activity:7190031020929228801/


Great post!
I agree with your characterization that offshore wind cannot save New England. I will go further.
After years of research and study of the challenges of wind, solar, and energy storage, I have evolved away from any support for those technologies in anything but niche applications. Ultimately, ignoring nuclear and relying upon weather-dependent resources to go to a zero-emissions grid necessitates unacceptable risk. There are weeklong periods where there’s no wind and little sun and that introduces tradeoffs not present in the existing electric system.
After decades of experience with the components of the existing electric system electric planners have a very good understanding of resource availability. The key point is that they do not have to worry about correlated outages across the electric system. Relying on wind and solar means that there will be correlated periods across vast areas when all generating resources are low. Furthermore, those periods correspond to the highest load demands while net-zero transition plans want to electrify everything possible. In order to “solve” that problem more and more energy storage or the magical dispatchable and emissions free resources will need to be deployed.
At some point we simply cannot afford to plan for the observed worst-case with a return period of ten, twenty, fifty or more because the backup sources will never pay for themselves. Inevitably there will be a wind and solar drought that exceeds the design case, insufficient energy will be available to meet load, and people will freeze to death in the dark.
Roger Caiazza, Pragmatic Environmentalist of New York Blog
Anyone who's ever been stood up on a date can relate. You get all dolled up, but the turbines stop spinning, and suddenly you're going nowhere.